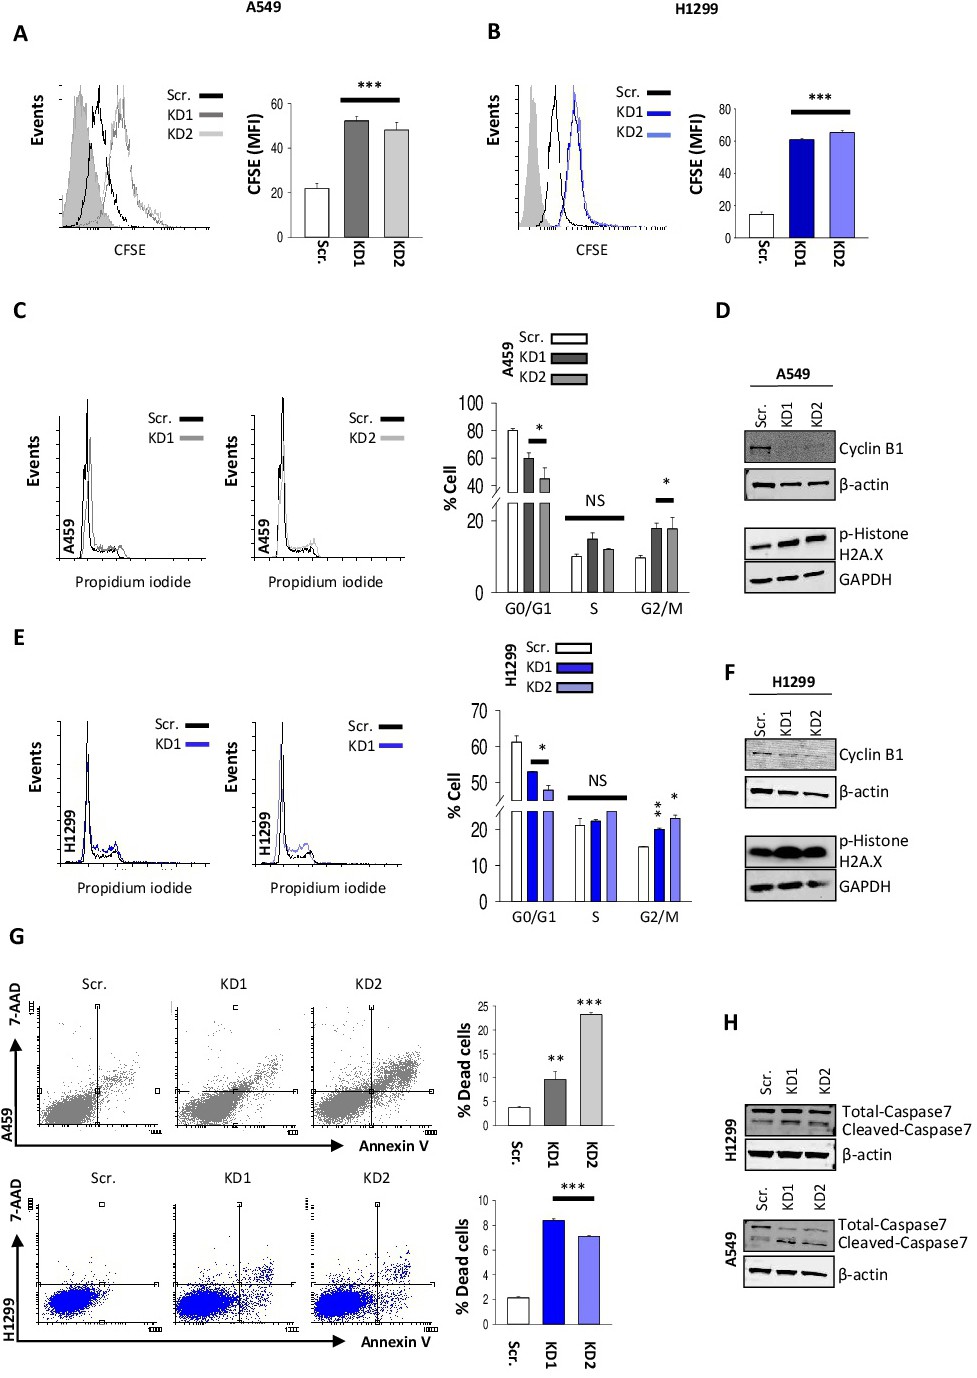
Fig. 2. TRPM2 downregulation inhibits NSCLC cells growth at G2/M and promotes apoptosis. (A & B) Histogram and bar graph presentation of CFSE proliferation analysis in A549 scramble and TRPM2 KD cells. (C & E) Cell cycle analysis of A549 cells by propidium iodide staining, results are summarized in a corresponding bar chart. (D & F) Western blot analysis of DNA damage and G2/M arrest markers (p-Histone H2A.X and Cyclin B1) (G) Annexin V/7-AAD staining of apoptotic and necrotic cells, percentage of dead cells were calculated and presented as a bar graph (H) Western blot analysis of cleaved caspase 7 (t test vs scr. ***, p<0.001; **, p<0.01; * p<0.05).